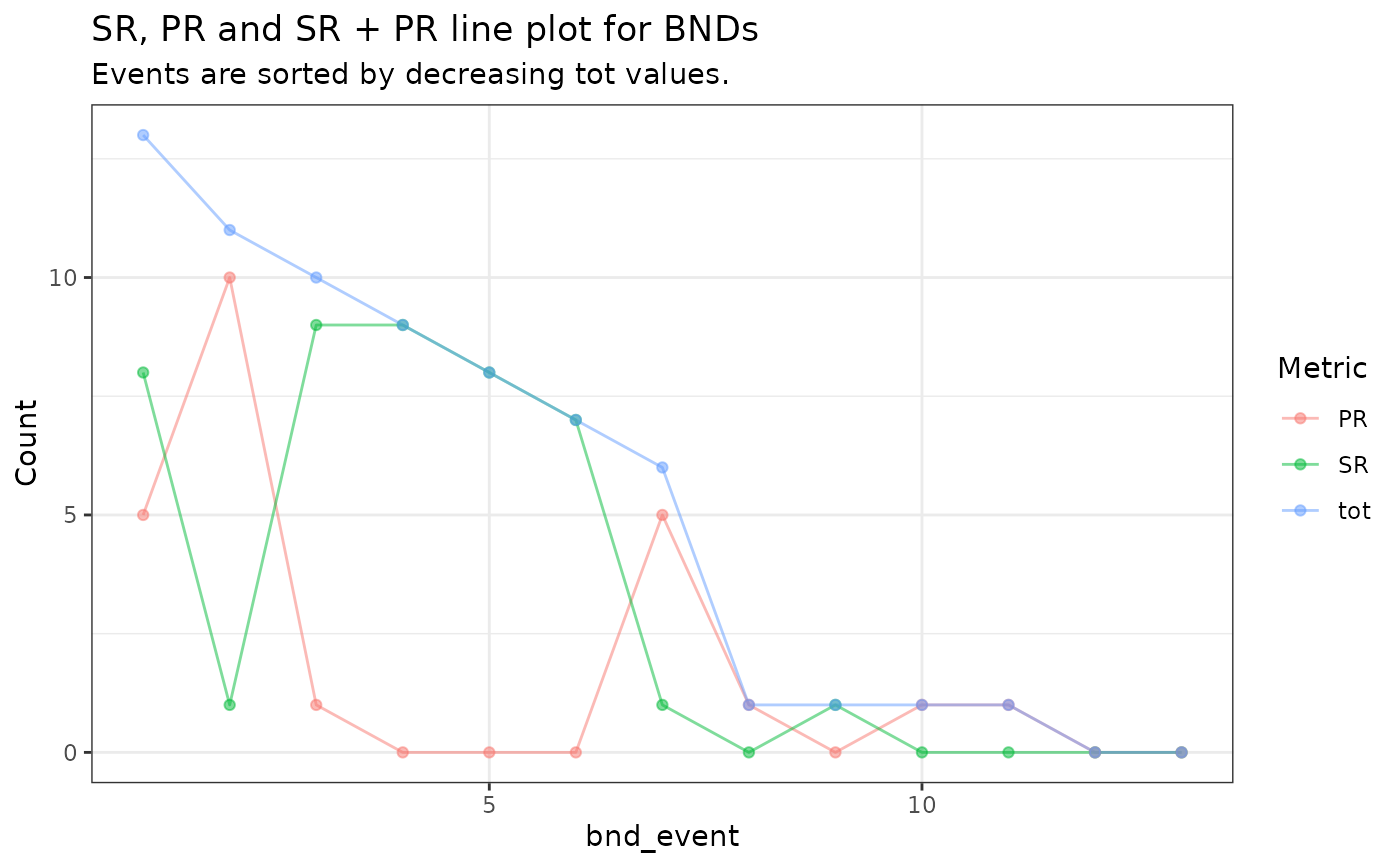
Plots the number of split reads (SR), paired end reads (PR), and their
sum (tot) across all BNDs, sorted by tot.
Usage
plot_bnd_sr_pr_tot_lines(
  d,
  title = "SR, PR and SR + PR line plot for BNDs",
  subtitle = "Events are sorted by decreasing tot values."
)
Arguments
- d
A data.frame with an SR_PR_alt column.
- title
Main title of plot.
- subtitle
Subtitle of plot.
Examples
x <- system.file("extdata/sash/sv.prioritised.tsv", package = "gpgr")
d <- process_sv(x)$map
plot_bnd_sr_pr_tot_lines(d)
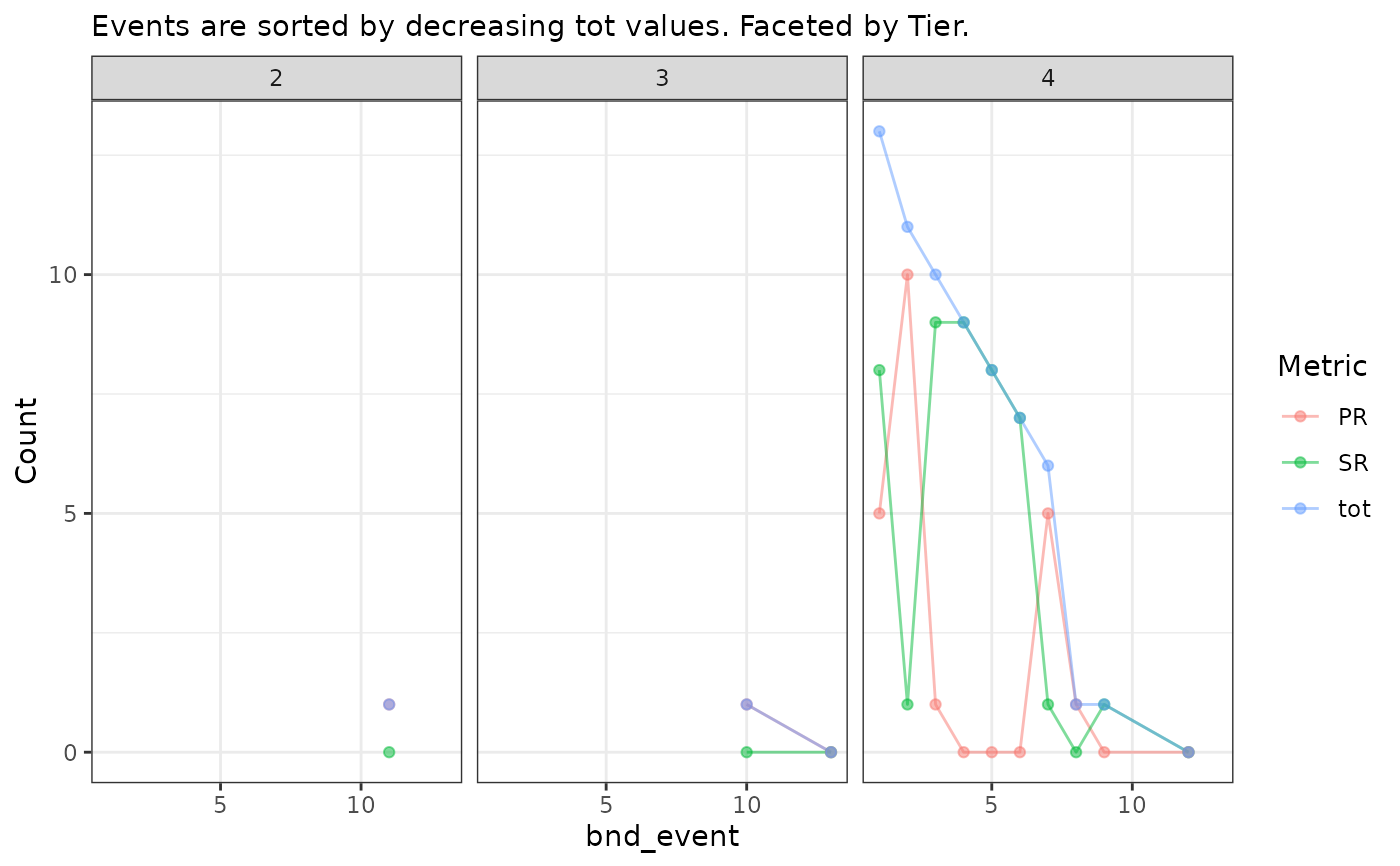
#> $p_all
 #>
#> $p_tier
#> `geom_line()`: Each group consists of only one observation.
#> ℹ Do you need to adjust the group aesthetic?
#>
#> $p_tier
#> `geom_line()`: Each group consists of only one observation.
#> ℹ Do you need to adjust the group aesthetic?
 #>
#>