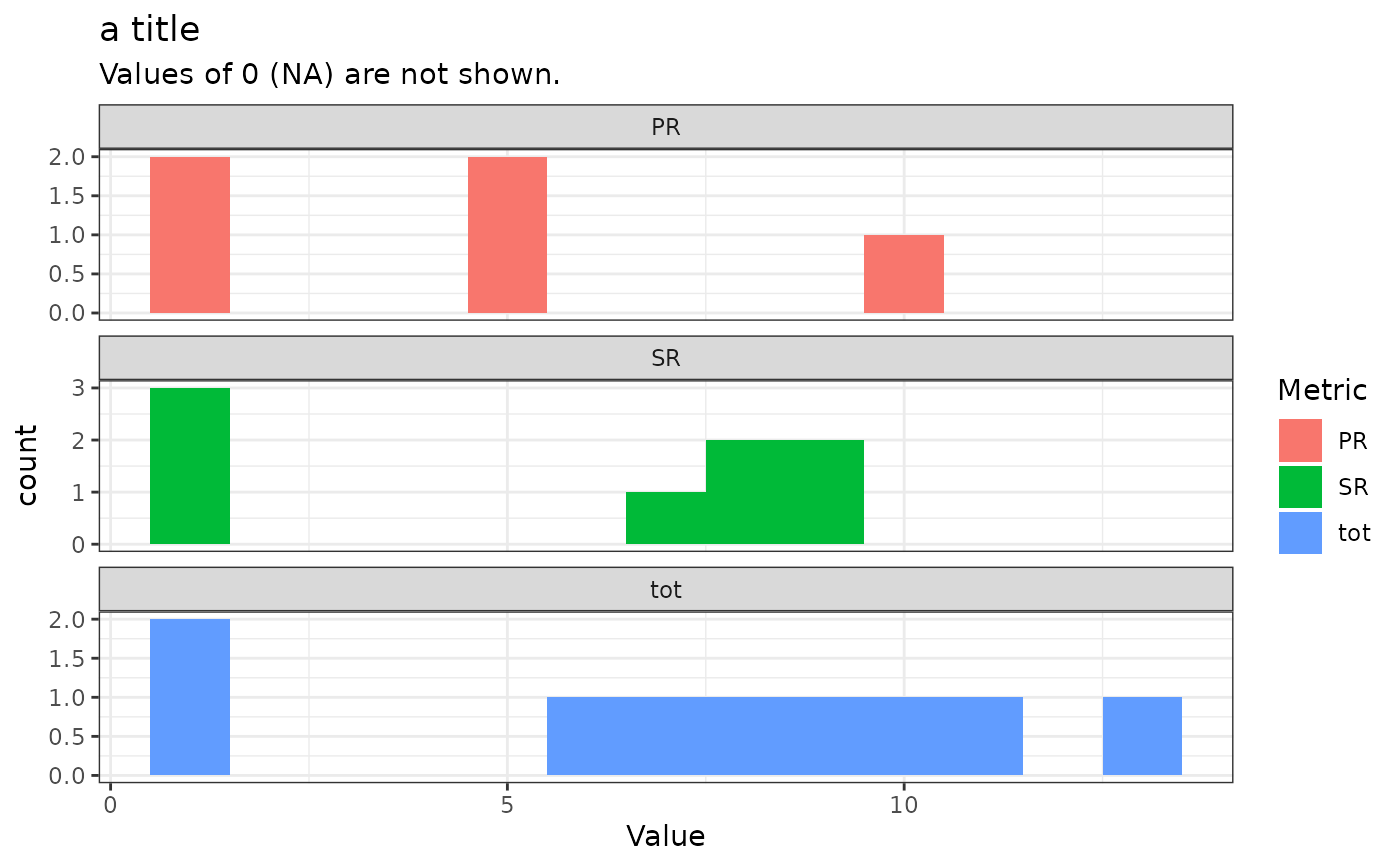
Plots histograms for the number of split reads (SR), paired end reads (PR), and their
sum (tot) across all BNDs. Observations where the SR or PR value is 0 (NA) are not shown.
Usage
plot_bnd_sr_pr_tot_hist(
  d,
  title = "SR, PR and SR + PR histogram for BNDs",
  subtitle = "Values of 0 (NA) are not shown."
)
Arguments
- d
A data.frame with an SR_PR_alt column.
- title
Main title of plot.
- subtitle
Subtitle of plot.
Examples
x <- system.file("extdata/sash/sv.prioritised.tsv", package = "gpgr")
d <- process_sv(x)$map
plot_bnd_sr_pr_tot_hist(d, "a title")