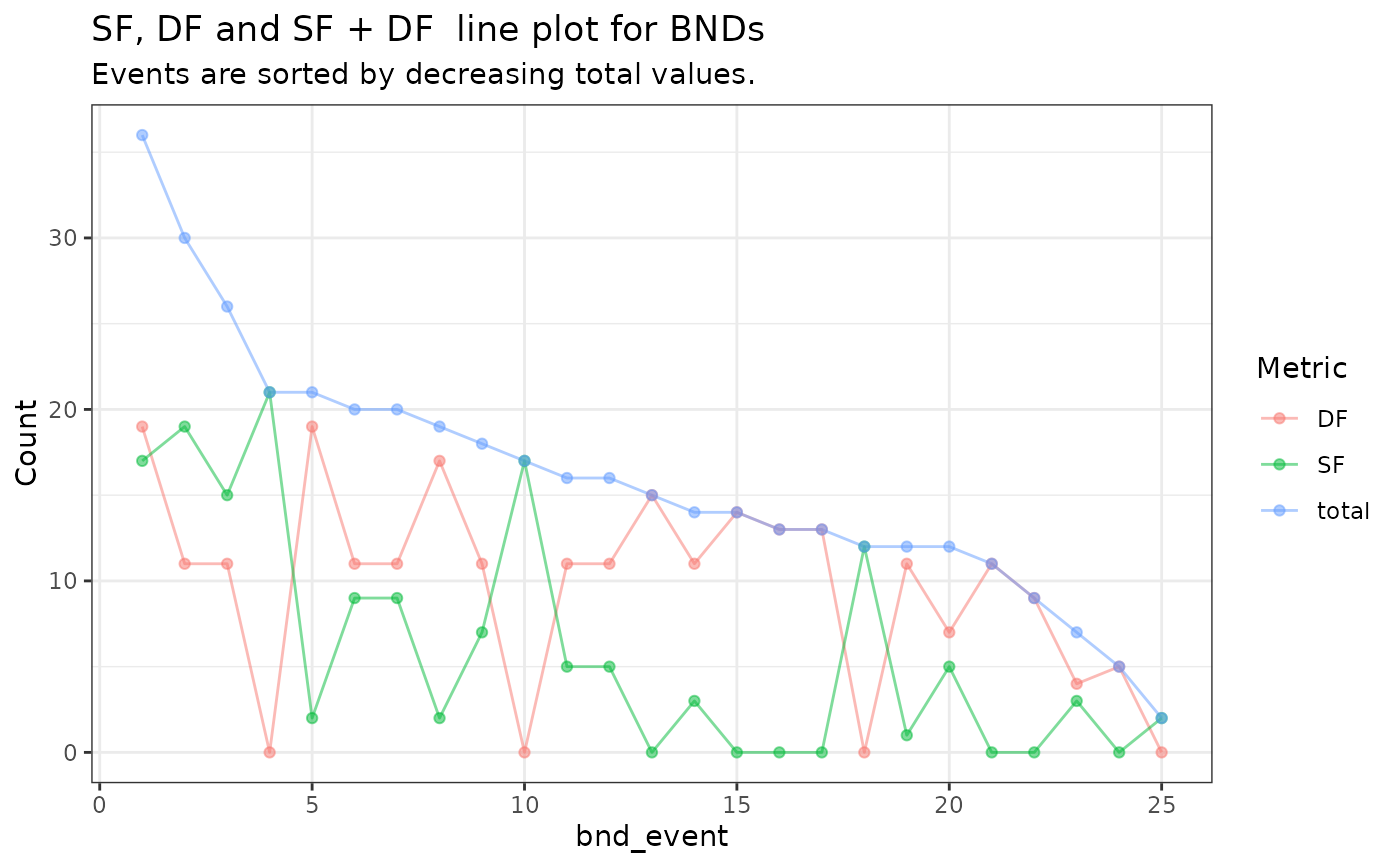
Plots the split fragments (SF), discordant fragments (DF), and
the total fragments (SF+DF) across all BNDs, sorted by total value.
Usage
plot_bnd_sf_df_tot_lines(
  d,
  title = "SF, DF and SF + DF  line plot for BNDs",
  subtitle = "Events are sorted by decreasing total values."
)
Arguments
- d
A data.frame with SF_alt, DF_alt, and SF_DF_alt columns.
- title
Main title of plot.
- subtitle
Subtitle of plot.
Examples
x <- system.file("extdata/sash/sv.prioritised.tsv", package = "gpgr")
d <- process_sv(x)$map
#> Warning: There was 1 warning in `dplyr::mutate()`.
#> ℹ In argument: `SF_DF_sum = dplyr::case_when(...)`.
#> Caused by warning in `Ops.factor()`:
#> ! ‘+’ not meaningful for factors
#> Warning: There were 2 warnings in `dplyr::mutate()`.
#> The first warning was:
#> ℹ In argument: `.group_key = ifelse(...)`.
#> Caused by warning in `pmin()`:
#> ! NAs introduced by coercion
#> ℹ Run `dplyr::last_dplyr_warnings()` to see the 1 remaining warning.
#> Warning: There was 1 warning in `dplyr::arrange()`.
#> ℹ In argument: `..2 = as.numeric(.data$ID)`.
#> Caused by warning:
#> ! NAs introduced by coercion
plot_bnd_sf_df_tot_lines(d)
#> $p_all
 #>
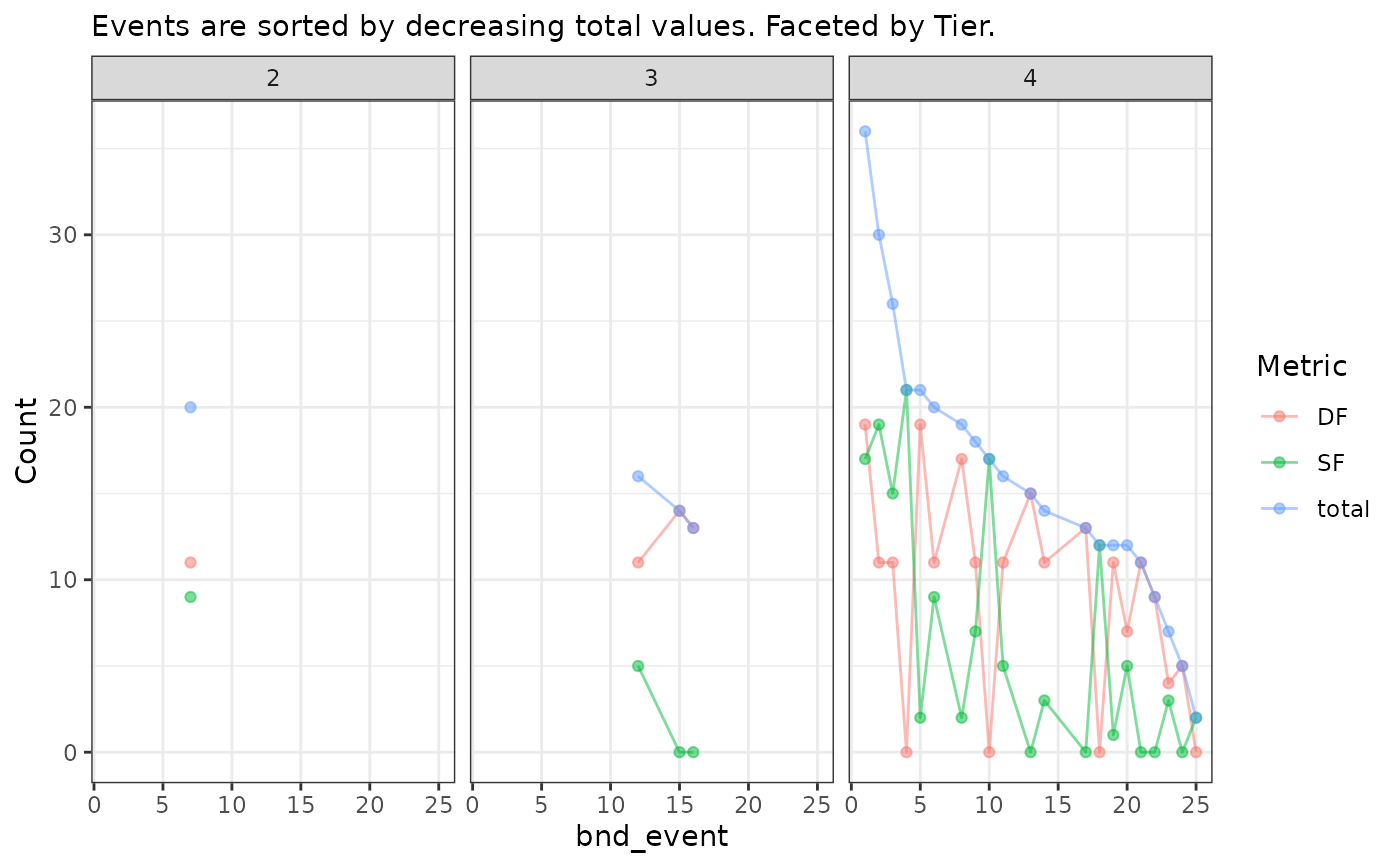
#> $p_tier
#> `geom_line()`: Each group consists of only one observation.
#> ℹ Do you need to adjust the group aesthetic?
#>
#> $p_tier
#> `geom_line()`: Each group consists of only one observation.
#> ℹ Do you need to adjust the group aesthetic?
 #>
#>